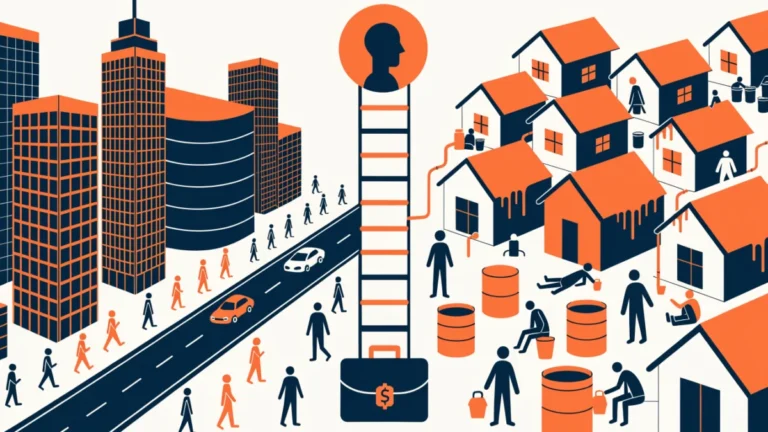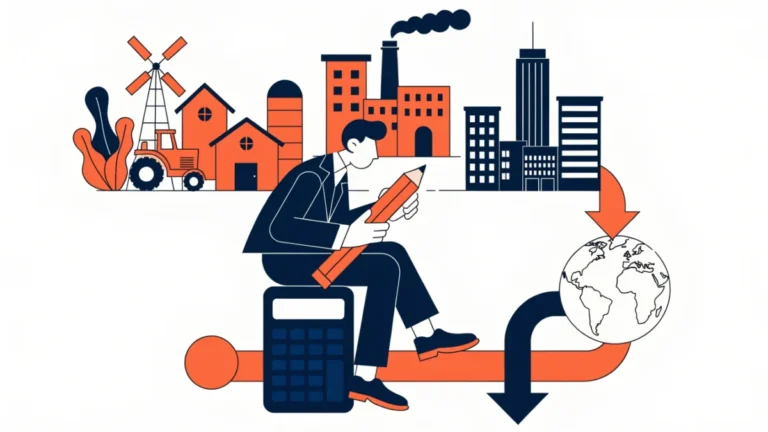
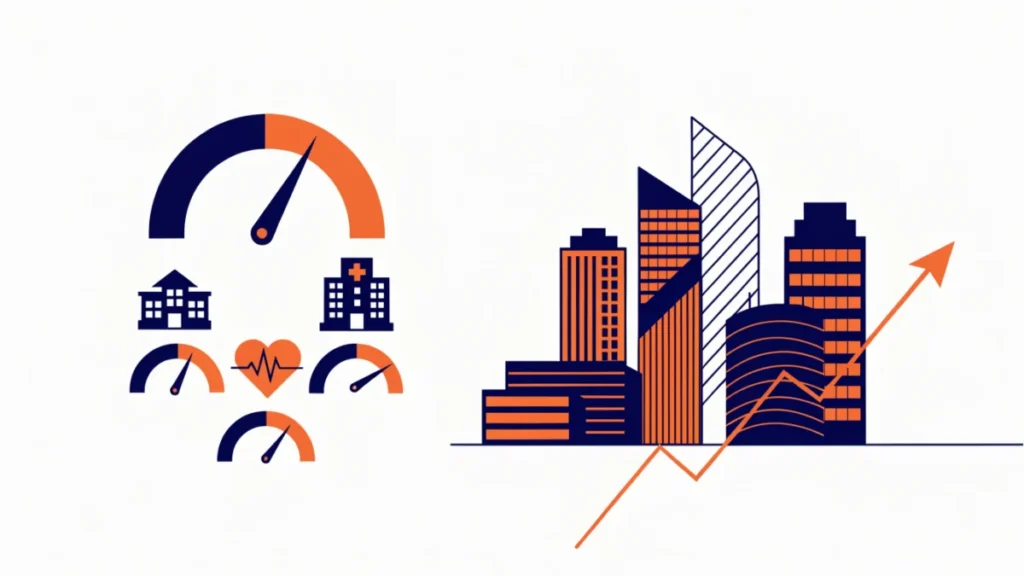
The five main indicators of economic development are national income, per capita income, the Physical Quality of Life Index (literacy, infant mortality, life expectancy), the basic needs approach and the Human Development Index (health, education, income). The Multidimensional Poverty Index is a newer addition. India ranked 130th of 193 on HDI (score 0.685) in the 2025 report.
India is the world’s fourth or fifth largest economy by GDP, yet it ranked 130th out of 193 countries on the UN’s Human Development Index in the 2025 report. Both statements are true, and the gap between them is exactly why economists use more than one indicator to measure development.
Economic growth means more output. Economic development means people actually live better: they earn more, live longer, read and write, and can meet their basic needs. Here are the five main indicators used to measure it, plus a newer sixth one, with India’s numbers for each.
1. National Income (GDP or GNP)
The total value of goods and services an economy produces in a year. It is the oldest and most widely used measure. A rising real GDP shows the economy is producing more.
Limitation: it says nothing about how income is shared. A country can grow fast while most people see little change. It also ignores unpaid work and environmental damage.
2. Per Capita Income
National income divided by population. It adjusts for the size of the country, so it is a better guide to the average person’s living standard. The World Bank uses gross national income (GNI) per capita to classify countries: for FY26, lower-middle-income means $1,136 to $4,495 per person. India falls in that group.
Limitation: it is still an average. A few very rich people can lift it while the majority stay poor.
3. Physical Quality of Life Index (PQLI)
Developed by Morris David Morris in 1979, the PQLI combines three measures on a 0 to 100 scale: literacy rate, infant mortality and life expectancy at age one. It shifted attention from income to actual outcomes. Kerala is the classic case: for decades it scored much higher on PQLI than its income level would predict.
Limitation: it leaves out income entirely and gives equal weight to the three components without strong justification.
4. Basic Needs Approach
Promoted by the International Labour Organization at its 1976 World Employment Conference, this approach asks whether people have enough food, clean water, shelter, healthcare, education and sanitation. Development means meeting these needs for everyone, especially the poorest.
Limitation: deciding what counts as a basic need, and at what level, is subjective and varies across countries.
5. Human Development Index (HDI)
Launched by the UNDP in 1990, based on the work of Mahbub ul Haq and Amartya Sen. The HDI combines three dimensions: a long and healthy life (life expectancy), knowledge (expected and mean years of schooling) and a decent standard of living (GNI per capita). Scores run from 0 to 1. In the 2025 Human Development Report, India scored 0.685 and ranked 130th, in the medium human development category.
Limitation: it ignores inequality, freedom and the environment, though the UNDP now publishes inequality-adjusted and planetary-pressures-adjusted versions.
6. Multidimensional Poverty Index (MPI)
Developed by Oxford’s OPHI and the UNDP in 2010, the MPI counts people who are deprived on several fronts at once, such as nutrition, schooling, cooking fuel and housing. NITI Aayog estimated India’s multidimensional poverty fell from 29.17% in 2013-14 to 11.28% in 2022-23, meaning about 24.8 crore people moved out of it.
Comparison of Indicators
| Indicator | Measures | Introduced | Main weakness |
|---|---|---|---|
| National income | Total output | 1930s onwards | Ignores distribution |
| Per capita income | Average income | Long-standing | Hides inequality |
| PQLI | Literacy, infant mortality, life expectancy | 1979 | Leaves out income |
| Basic needs | Access to essentials | 1976 (ILO) | Subjective |
| HDI | Health, education, income | 1990 (UNDP) | Ignores inequality |
| MPI | Overlapping deprivations | 2010 | Data-heavy, infrequent |
No single indicator tells the whole story. Use income measures for economic size and HDI or MPI for how people actually live. For related reading, see our national income questions and answers.